The event that just ended
Amazon Prime Day 2026 ran June 23-24. U.S. e-commerce across all retailers hit $14.2 billion over the two days, according to eMarketer. Adobe's broader estimate, which includes all retail destinations during the event window, projects a full four-day figure of $26.3 billion. Record numbers either way.
Post-event analysis tells a different story.
Measured tracked how 90 U.S. brands split their media spend during Prime Day — and the results contradict what most paid media teams assumed they needed to do.
Three strategies, one winner
The 90 brands fell into three camps based on how they managed spend during the event window:
67% pulled back to protect ROAS efficiency. They saw -22% average daily revenue during Prime Day.
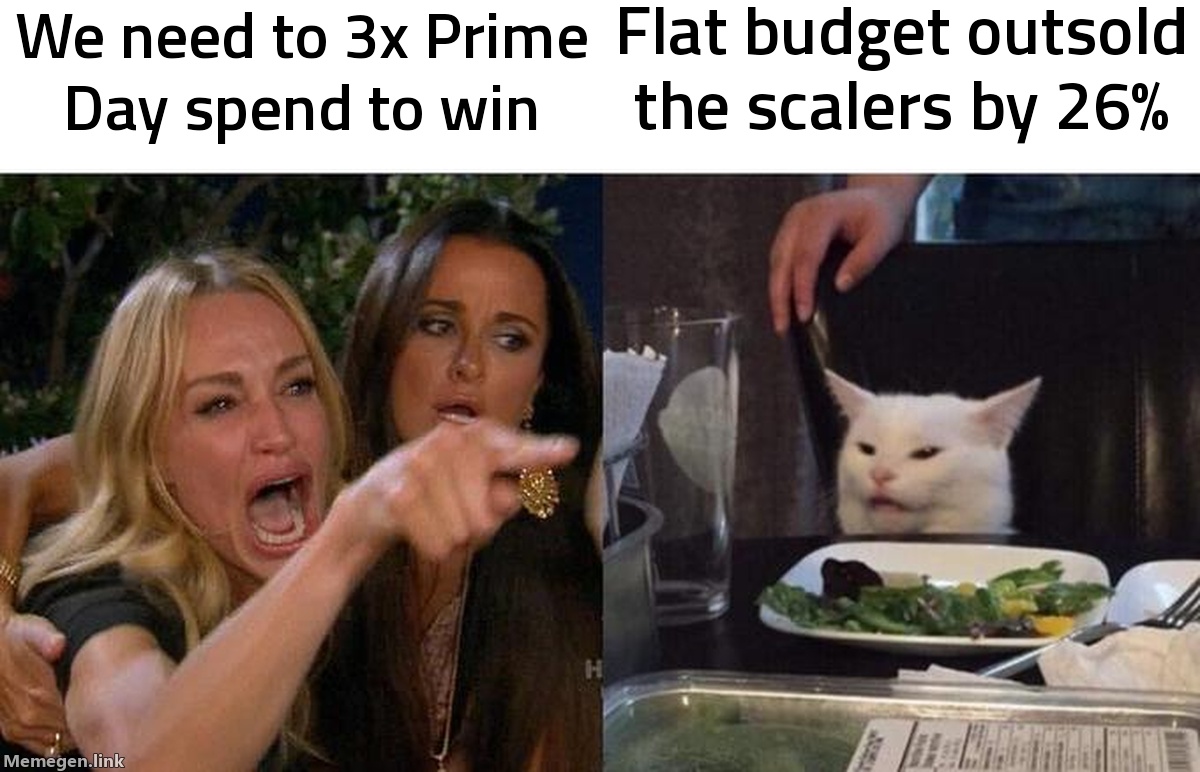
14% aggressively increased spend to compete in the event environment. They saw -12% average daily revenue.
19% held spend flat — same weekly pacing they'd run in any normal non-event week. Those brands averaged +26% average daily revenue during Prime Day.
The strategy that looked passive won.
Why flat hold worked
The mechanism is in how Prime Day generates demand. When Amazon's event launches, it pulls a wave of purchase intent into the market. Consumers who weren't thinking about buying a product start searching, comparing, and deciding.
That intent doesn't stay on Amazon. Fifty-seven percent of Prime Day shoppers compared Amazon's prices with at least one other retailer before completing a purchase, according to Numerator's live tracker. Those comparison-shoppers opened other tabs. They ran Google searches. They landed on DTC sites.
Brands running normal ad presence captured that overflow traffic at normal CPMs. Brands that pulled back disappeared from exactly the moment that traffic was searching for them. The instinct to protect efficiency cost them the event.
Brands that scaled aggressively hit a different wall. They were bidding against Amazon Sponsored Products, competitor brands also scaling up, and the general CPM inflation that comes with any high-intent moment. Their spend went up. Their conversion efficiency went down. The math didn't close.
Flat hold worked because Prime Day's demand creation is a rising tide. You don't need to pay more to catch a tide — you need to still be in the water.
What the consumer behavior data shows
There's a second story in the Numerator data worth building into Q4 planning.
Average Prime Day 2026 order value: $48.36, down from $58.37 in 2025 — a 17% drop per transaction. Total average household spend fell from $126 to $104. More transactions, smaller baskets. 70% of purchases were under $30.
44% of Gen Z shoppers used buy-now-pay-later services during the event. Consumer participation was high. Consumer confidence was stretched.
This changes the creative brief for the next big event. Shoppers in 2026 weren't rejecting purchases — they were anchoring on the lowest available price and financing the rest. Ads showing absolute prices outperformed percentage-off framing in Q4 2025 for the same reason. If your typical product sits above $100, Prime Day 2026 was structurally unfriendly and that pattern will likely hold through this holiday season.
A media dollar on your site versus Amazon
Measured's study surfaced one additional finding that shifts the math for brands running both on-Amazon and off-Amazon campaigns simultaneously.
A media dollar spent driving traffic to a brand's own site was five to six times more efficient than a dollar driving an Amazon conversion during Prime Day. That ratio exists year-round — but Prime Day amplifies it because Amazon's ad auction hits peak competition for 48 hours straight. Every other brand is bidding up Sponsored Products at the same moment. Your own site's auction was comparatively quiet.
If you reflexively shifted budget toward Amazon Sponsored Products heading into June 23, you paid peak-market rates on Amazon while leaving a quieter, more efficient channel partially unfunded.
Before Black Friday
Prime Day is over. The next major pressure window is Prime Big Deal Days in October, then Black Friday-Cyber Monday in November.
Before each event, don't default to "should we increase budget." Model three scenarios explicitly and decide in advance which approach you'll run. Tag your revenue outcomes to your spend approach so you find out which camp your brand actually falls into.
Measured's 90-brand study is a strong prior, but averages obscure real variance. There are brands where aggressive scaling works — usually those with enough category-level market share to absorb CPM competition without ROAS collapse. If that's your situation, your Q4 plan should look different from a mid-tier DTC competitor running the same brand.
If you don't know which camp your account belongs in, the free audit at Gromerce surfaces the spend efficiency signals that tell you whether you've been running the strategy that worked or the one that felt productive.
Prime Day 2026 gave every DTC brand a test result. Most still don't know what they scored.
Sources: Measured, Numerator, eMarketer, Fortune, Adobe Analytics, June 2026